The Silence of Mother Whale
Once upon a time, on the island of Ouvéa—where the water is clear and fish dance through coral gardens, far from waste and noise—there lived a young girl.
One day, she left to study on the mainland, near Nouméa. There, the sand bore traces of loss: plastic, cans, bottles washed ashore.
Her heart grew heavy as the elders murmured, “The Mother Whale is calling us.”
So the girl chose to dive. Not into the turquoise lagoon of her childhood, but into a different ocean—one made of words, numbers, and data.
She learned to read the invisible. She listened to curves, percentages, silent maps. And when she understood, she rose to the surface and in her hands, more than knowledge—she held a message.
She returned home. Not with pockets full of shells, but with a heart ready to speak what the sea could no longer say.
A Data Visualization project by Pélagie Sivitongo, a proud student of Lycée Polyvalent du Mont Dore
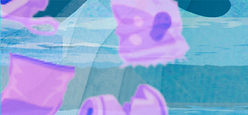
Hover over the image to unveil what the eye cannot see...


Beach litter density (per square kilometer):
Marine litter endangers ecosystems and biodiversity, while also harming the economy—especially through its effects on tourism, fisheries, and aquaculture—as well as posing risks to human health. This indicator tracks the volume of waste found on beaches, based on satellite observation data. Data set here.
.png)
How to Read it
Methodology
To understand the impact of plastic waste in the Pacific islands, I began by diving into the data. I looked for trends, patterns, and hidden stories.
Several narratives emerged, but the one I chose to tell is this: the ocean is vast, and if we don’t explore it, we don’t see the pollution—or worse, we may choose to ignore it.
Next, I drew inspiration from existing visualizations. I created a moodboard filled with styles, colors, and shapes that resonated with my topic.
My favorite reference: the whale — whose yearly migration is tied to the sea breeze that helps push the yam upward.
I then sketched out several ideas, experimenting with different visual formats. Among these drafts, one strong concept stood out. This nearly final visual became the reflection of my commitment: to translate complex data into a message that is clear, sensitive, and accessible.